

Galaxy: Milky Way. Planet: Earth, Solar System. Date: Year of the Rat, number 4718 from Huangdi, the Yellow Emperor. Spaceship: Pandora FMS Enterprise. Voyager 2 spaceship reports that its older twin sister is 20 hours, 46 minutes, and 19 seconds away from the blue planet at light speed. Radio waves travel almost at that speed, and although its plutonium reserve is depleted and the electronic components are almost frozen, despite all that, we receive signals from them. Meanwhile, here we use fiber optics and that damn file in ISO format of almost 5 gigabytes still does not download completely. What is happening?
If we are network administrators or programmers, users ask us from time to time – and with confidence – why it takes so long to download. It is useless to explain to them that their old platter disk is unable to get hold of the 600 mbps of the new modem… the problem must be on the network and not on their computers..
And to be fair,to some degree they are right. We may have the most impressive flow rates with the latest generation technology, but if a large number of users connect to our database server, while in our local area network we do data backups or move computers with several petabytes going around our private routers and hubs, yes, the delay will take its toll..
With the increasing reliance on network services for critical business applications, the smallest change in network usage can affect network performance and reliability. This has a direct impact on the ability to carry out key functions from a business point of view and the cost of keeping network services. That is why network traffic analysis tools are so important.
What can Pandora FMS Enterprise do for us, mammalian earthlings? Today I am going to tell you, with my feet firmly on planet Earth.
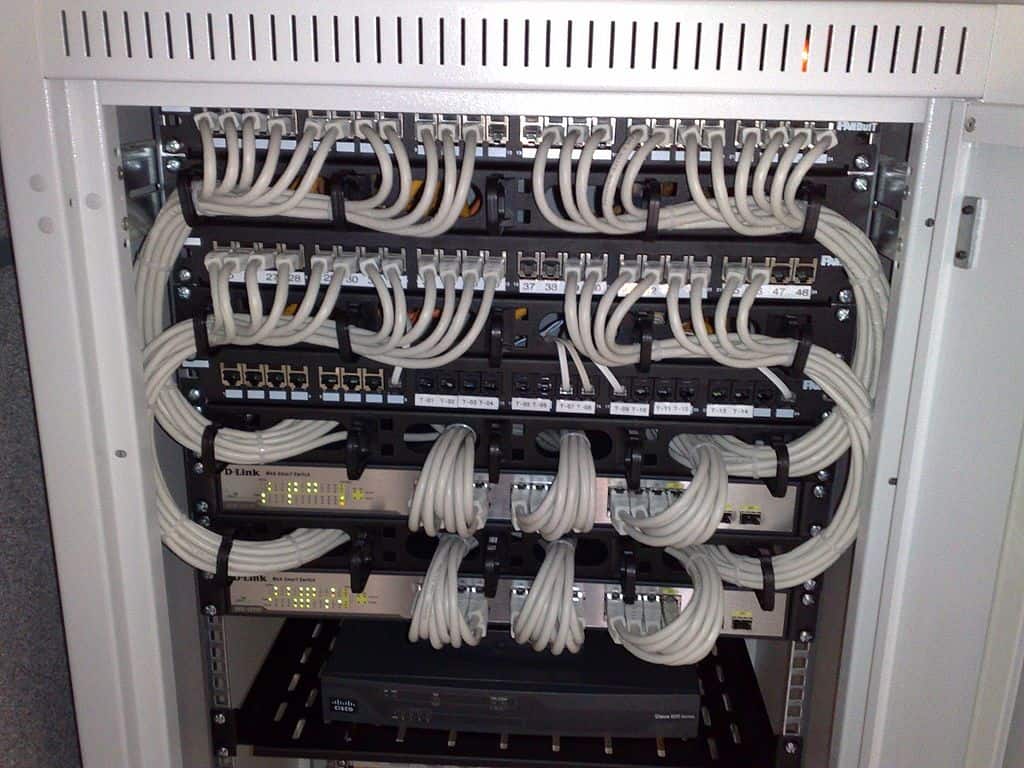
Ethernet switches in a 19 inch wide cabinet (https://commons.wikimedia.org/wiki/File:19-inch_rackmount_Ethernet_switches_and_patch_panels.jpg)
Basic concepts
In this blog we constantly share our knowledge, and although you most likely already know what bandwidth is and the tools to measure it or what exactly network monitoring is, it is always good to review it.
It is also necessary to check instruments that are, at least in part, network traffic analysis tools: syslog that generate routers, hubs and fire walls (by hardware or by software according to standard RFC 3164 via UDP through port 514). These inform about the connections and disconnections of the WAN services and devices, the status of the Virtual Private Networks (VPN), which network connections were allowed and which were deleted in the firewall, etc.
And other concepts have changed or even died… For example, with the huge amount of websites that use free digital certificates from Let’s Encrypt, deep packet inspection has become difficult, and that without taking into account that:
- The new DNS over HTTPS protocol, which prevents Internet Service Provider or ISP from knowing which domains you visit.
- Even the domain name itself that you are requesting is encrypted.
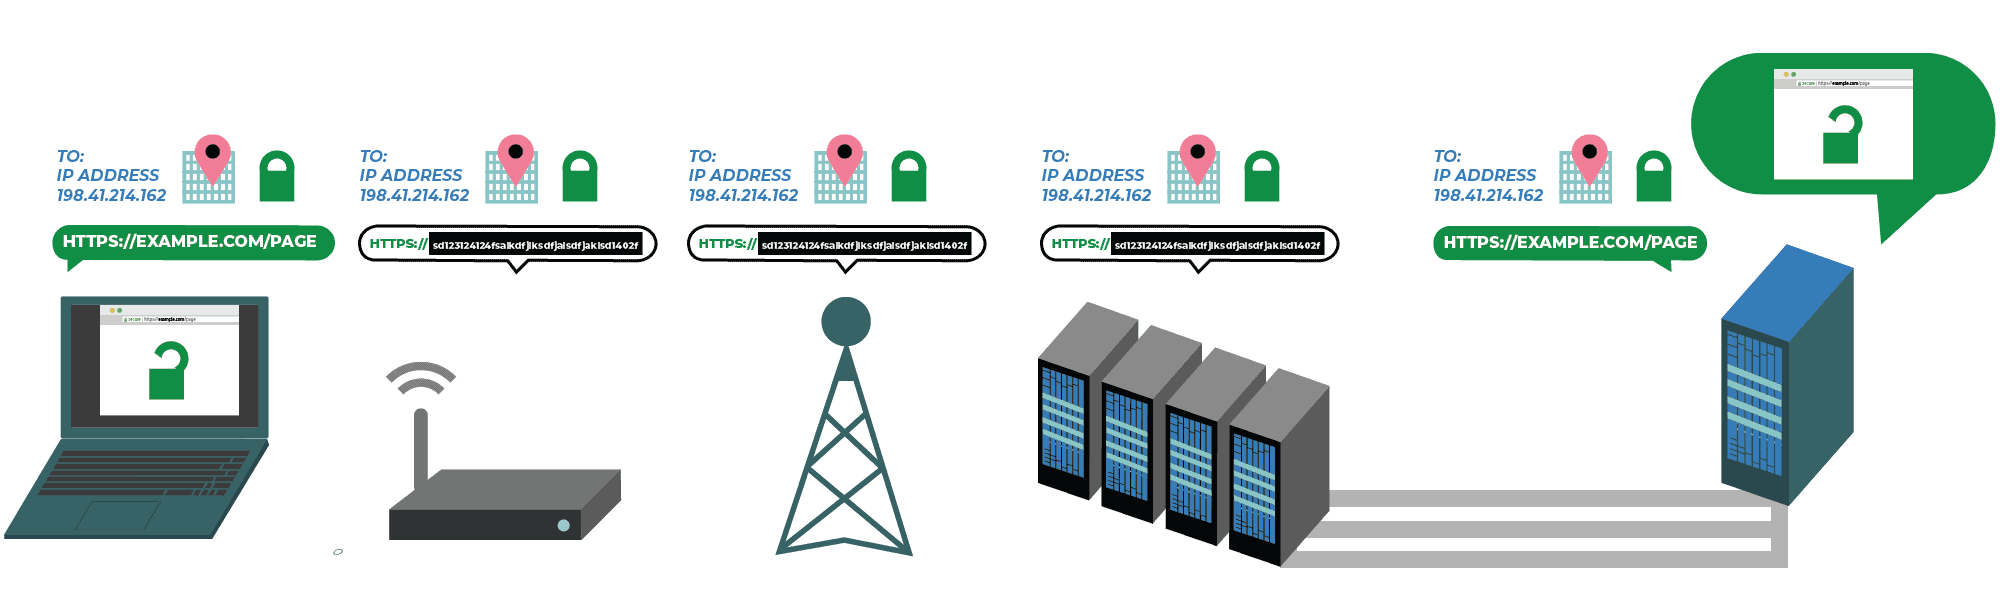
A Privacy-Protecting Upgrade to HTTPS (https://www.eff.org/deeplinks/2018/09/esni-privacy-protecting-upgrade-https)
Now, within network traffic analysis tools there is theSimple Network Management Protocol a technology mastered by Pandora FMS Enterprise. Pandora FMS has a large Managed Information Base (MIB) registered, since each manufacturer includes its own definitions, which are incompatible with others. You could say it’s like the user manual of a washing machine: there are many types and, although they serve the same purpose, each one does it in its own way. But the biggest drawback of SNMP is that it contributes little to the analysis of network traffic. That is why a tool that went further was needed.
Just as Nagios was some kind of father to several monitoring programs, NetFlow® has multiple x-Flow successors. While version 9 made its way as a public standard, it was version 10 that made the leap with the Internet Protocol Flow Information Export (IPFIX) to add flexibility to users and thus be able to include more fields on which to report (basically include more types of metrics).
For this, templates are used and they describe the encapsulated data and are sent only at the beginning of each session. Although Cisco®, the company that created the popular protocol, assigned a code to each manufacturer and/or partner to identify their templates, this does not prevent someone else from numbering their own templates, which although it does not seem like a major problem, that possibility of repeating code is there, underlying.
Do you remember the example of the washing machines? Well, here it is not worth reading the manual and memorizing it, you have to read the manual (template) thoroughly in each session to make sure that all the metrics that they sent us to collect are actually there (if not, for that you have Pandora FMS alerts) and if there is excess of information, discard it. Or, if you have lots of hard drives, then save them just in case… I think that when we achieve something of this so-called Artificial Intelligence, it will be able to reel and digest these additional fields and send you an alert to Pandora FMS console: “Your new NetFlow® dashboard (or X-Flow) is ready to go.”
Another disadvantage of NetFlow® is that it is present in high-value network hardware, since these devices do something really incredible: all network traffic that goes through a router or hub can be “copied” and sent to one of the ports, where in turn you will connect a probe that can collect all that traffic. If you don’t have this type of network hardware, any other can always be connected to a Terminal Access Point (TAP), which works in layer level 1 of the Open System Interconnection model (OSI).
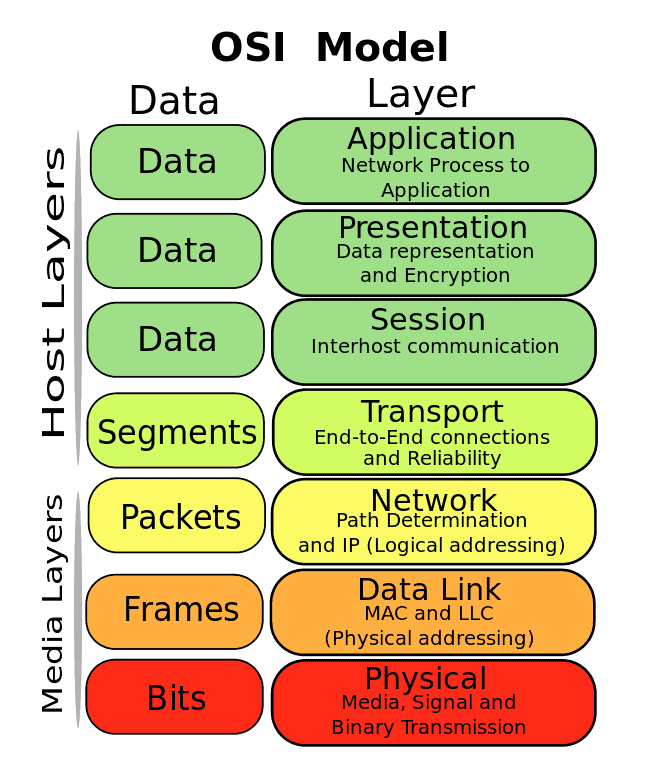
OSI model (https://commons.wikimedia.org/wiki/File:Osi-model-jb.svg)
But it is easier said than done. Before, this type of gadget did not affect network connections at all, but as of today:
- Hubs are almost gone. Those devices that forward all packets to all Ethernet ports, so our network TAP would work without major problems. Most are now unmanaged switches that can discern who to forward to and even have the Quality of Signal(QoS) protocol, which essentially prioritizes connections that contain audio and video in real time. Our telecommuting users really appreciate this technology (even if they are unaware of its existence).
- In the case of managed switches, the drawback is that their configuration can be erased and you will have to set it again. However, Cisco® computers and some other brands using NetFlow® do not have this problem (and we do not need network TAP for them).
- With modern Gigabit Ethernet connections (1000 mbps) you will need specialized chips to discern the signals they receive and then forward them to the monitoring port, and for that you need electricity: in case of a power failure in TAP, it will affect the entire network it is connected to (unwanted behavior).
- With fiber optic connections, a percentage of the photons will simply be deflected, which could decrease the maximum distance of the connection (need for energized repeaters).
But do not get mad at NetFlow® : it was a wise decision to move their data in binary format and by UDP, that reduces network traffic (even if you have your own local area network, it will always save time and money).
I would like to point out sFlow® (short for sampled flow), which I consider has become more popular over the years and is supported by numerous manufacturers (and software solutions that we’ll see soon). The main thing is that it has backward compatibility and can work from layer 2 to layer 5 of the OSI model. This entails several advantages and not to mention that you can even make use of binary serialization format “Cap’n proto” (not by default) to send your metrics as efficiently as NetFlow®. Version 4 of sFlow® was specified in the RFC 3176 standard (now obsolete) and the current standard is in version 5. This standard is run by the sFlows® Organization Consortium.
Nine network traffic analysis tools
- nTop: Qualified as essential by Pandora FMS Team. What else can I say? Oh yeah, it can take sFlow® data (and otherX-Flow) with the nProbe tool and present it as NetFlow® to generate your reports. It tops our list because, in addition, it indirectly stars in the next item.
- Pandora NTA: Whose name comes from “Network Traffic Analyzer”. It comes from forking the nTop code and adding algorithms in Perl language so that the Pandora FMS server can receive the XML with the data collected with X-Flow. Pandora NTA is a network traffic analysis tool designed for environments where you do not want or you cannot use Netflow to analyze the network.
Pandora NTA is a simple way to monitor a network at a low level, without investing in specialized hardware or third-party tools, and incorporating that information into an existing monitoring platform. Pandora NTA offers:
-Detailed consumption by traffic, input and output of each local IP of a local network.
-Network problem detection (by generating events).
-Specific reports on network consumption, by source IP.
-A list of the network destination IPs with more traffic per source IP.
-Reports of local network consumption by source, dynamic maps and search and filtering options with accumulated data.
-With the individual traffic data of each network computer, Pandora NTA will be able to generate alerts, TopN reports and use any other Pandora FMS function, since they are saved as agent modules.
I recommend you to read the entire chapter devoted to this tool and do not hesitate to request if you wish a Pandora FMS Enterprise free trial.
- Wireshark: Another open source must-have, capable of collecting multiple X-Flows,available for different operating systems. Its many other features make it lean towards the security testing area, among other features.
- sflowtool: To be used through the command line (although it also has a graphical interface for real time, sFlowTrend), this open source tool is referred to as sFlow Org., and its source code relies on GitHub. It also uses nTop together with Snort and tcpdump to analyze network packet loss.
- ManageEngine Flow Analyzer: Commercial solution that has two versions, basic but limited (Essential) and payment version (Enterprise). It has alert and notification features, custom graphic dashboards, staff grouping (their machines and applications) and a funny byte billing feature.
- Nfsen: Although a reader pointed out that we left it out in a previous compilation, this year we did include it because it can deal with sFlow®, IPFIX (the basics) and some versions of NetFlow®. It makes a laudable attempt at handling Network Event Security Logging (NSEL) and NAT Event Logging (NEL), both proprietary Cisco® technologies. Actually Nfsen is the graphical part of nfdump, which is the one who really takes care of the above-mentioned tasks. Both are open source and Nfsen is used as a complement to LibreNMS (fork of Observium)
- Paessler PRTG: It collects metrics through Sensor sFlow V5. A while ago I made a comparison that you can find here. I just have to add that this solution is still active and that it also offers notifications for cell phones, 30 report templates for the results of lists of the first hundred in network use, in space use, online time, etc., among other features.
- Intermapper Flows®: Proprietary solution that includes JFlow®, sFlow® and NetFlow®. Its premise is “if it has an IP address, Intermapper® monitors it”, so we have another case -but combined- of graphical interface and complement. I only state that they also offer it to computer forensics, with the characteristics and features that this implies.
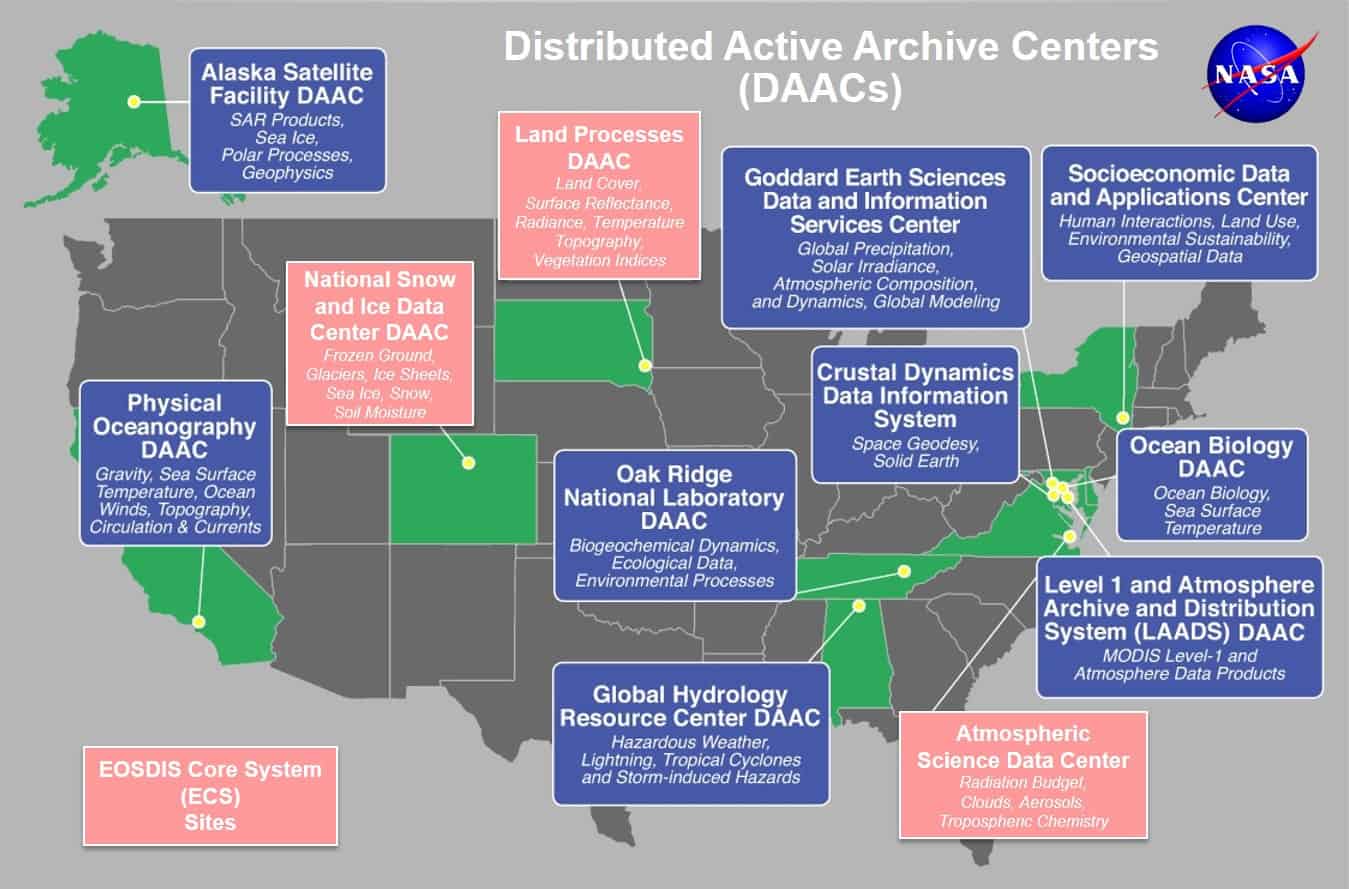
- FlowViewer: Even NASA scientists run away before having to use the command line, and as the name implies, this tool graphically represents the X-Flow (especially NetFlow®). It actually works with SiLK and RRDtool and is currently used in several states in the US that are connected to EOSDIS Distributed Active Archive Centers (DAACs). Literally out of this world, I say no more.
Before finishing, remember Pandora FMS is a flexible monitoring software, capable of monitoring devices, infrastructures, applications, services and business processes.
Would you like to find out more about what Pandora FMS can offer you? Find out clicking here .
If you have to monitor more than 100 devices, you can also enjoy a FREE 30-day Pandora FMS Enterprise DEMO . Get it here .
Last but not least, remember that if you have a reduced number of devices to monitor, you can use the Pandora FMS OpenSource version. Find more information here .
